There is a lot more to the Excel Regression output than just the regression equation. If you know how to quickly read the output of a Regression done in, you’ll know right away the most important points of a regression: if the overall regression was a good, whether this output could have occurred by chance, whether or not all of the independent input variables were good predictors, and whether residuals show a pattern (which means there’s a problem).
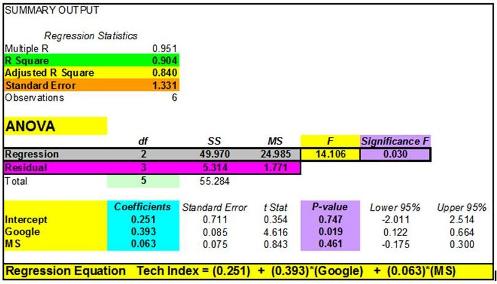
Excel Regression Output With Color-Coding Added
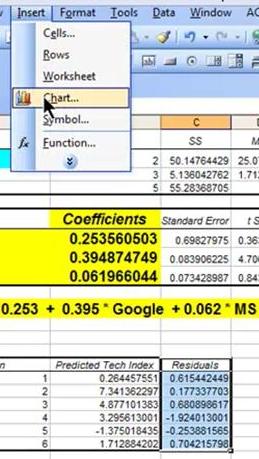
This video will illustrate exactly how to quickly and easily understand the output of Regression performed in Excel:
(Is Your Sound and Internet Connection Turned On?)
Amazon Kindle Users Click here to View Video
1) Overall Regression Equation’s Accuracy
(R Square and Adjusted R Square)
2) Probability That This Output Was Not By Chance
(ANOVA – Significance of F)
3) Individual Regression Coefficient and Y-Intercept Accuracy
4) Visual Analysis of Residuals
Some parts of the Excel Regression output are much more important than others. The goal here is for you to be able to glance at the Excel Regression output and immediately understand it, so we will focus our attention only on the four most important parts of the Excel regression output.
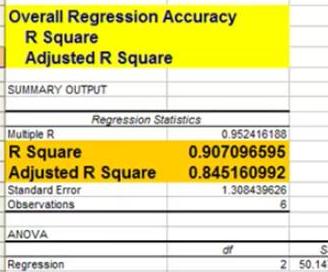
This is the most important number of the output. R Square tells how well the regression line approximates the real data. This number tells you how much of the output variable’s variance is explained by the input variables’ variance. Ideally we would like to see this at least 0.6 (60%) or 0.7 (70%).
This is quoted most often when explaining the accuracy of the regression equation. Adjusted R Square is more conservative the R Square because it is always less than R Square. Another reason that Adjusted R Square is quoted more often is that when new input variables are added to the Regression analysis, Adjusted R Square increases only when the new input variable makes the Regression equation more accurate (improves the Regression equation’s ability to predict the output). R Square always goes up when a new variable is added, whether or not the new input variable improves the Regression equation’s accuracy.
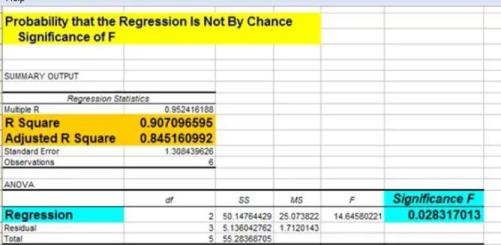
This indicates the probability that the Regression output could have been obtained by chance. A small Significance of F confirms the validity of the Regression output. For example, if Significance of F = 0.030, there is only a 3% chance that the Regression output was merely a chance occurrence.
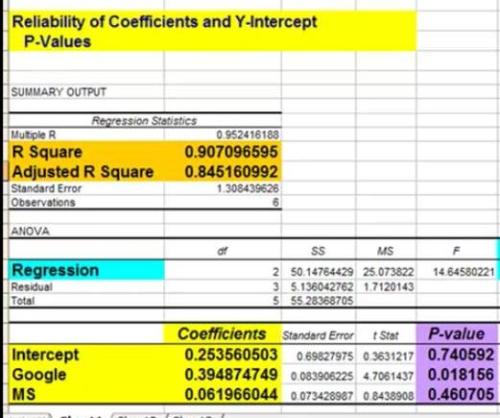
The P-Values of each of these provide the likelihood that they are real results and did not occur by chance. The lower the P-Value, the higher the likelihood that that coefficient or Y-Intercept is valid. For example, a P-Value of 0.016 for a regression coefficient indicates that there is only a 1.6% chance that the result occurred only as a result of chance.
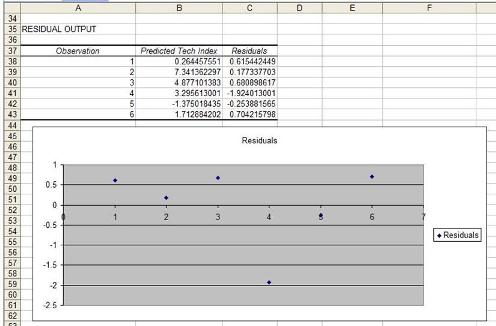
The residuals are the difference between the Regression’s predicted value and the actual value of the output variable. You can quickly plot the Residuals on a scatterplot chart. Look for patterns in the scatterplot. The more random (without patterns) and centered around zero the residuals appear to be, the more likely it is that the Regression equation is valid.
There are many other pieces of information in the Excel regression output but the above four items will give a quick read on the validity of your Regression.